
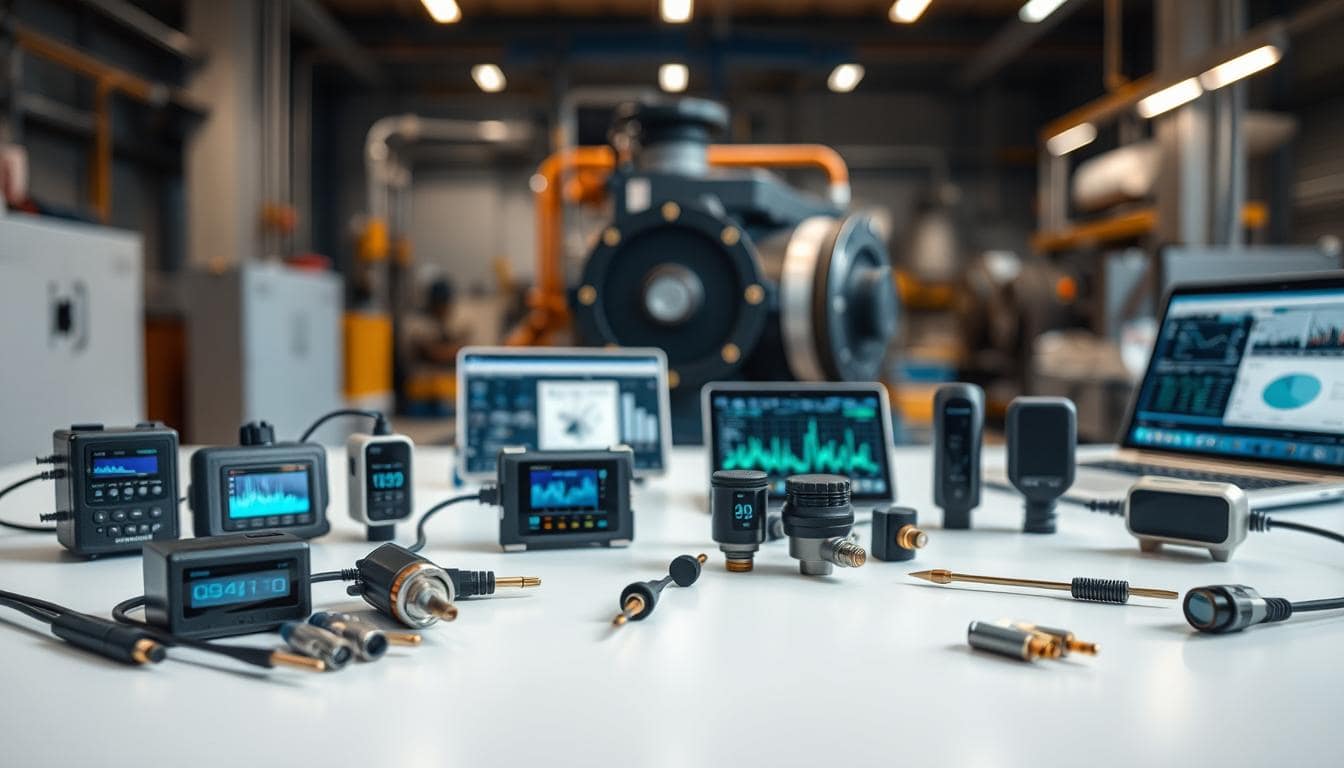
Modern industry needs a smart, tech-driven way to keep assets running and save on labor. This method, called predictive maintenance, uses a variety of predictive maintenance sensors and techniques.
Choosing the right tool is key. Not every technology works for every asset. The best match depends on the asset type and how it fails.
Using the wrong tool can be a waste. The right one keeps equipment running and lasts longer. You need to know what each technology does best.
This guide helps you understand. It looks at five main predictive maintenance techniques: vibration, thermal imaging, ultrasonic detection, oil analysis, and motor current signature analysis (MCSA).
The aim is simple. It gives you a clear plan to pick the best condition monitoring tool for your needs.
Choose the right PdM per asset class
Asset classification is key to a good condition monitoring program. Different machines fail in different ways. A single predictive maintenance plan doesn’t work for all.
Matching technology to asset is essential. Vibration analysis works well on rotating equipment but not on static hydraulic reservoirs. Oil analysis is great for gearboxes but not for electrical panels. You need to know how each asset works and fails.
A smart condition monitoring plan groups assets by type. Each group needs specific predictive tools for the best results.
High-Speed Rotating Equipment includes motors, pumps, fans, and compressors. These machines often fail due to mechanical wear like imbalance and bearing defects. Vibration analysis is the best tool here. Motor Current Signature Analysis (MCSA) also helps find electrical faults in motors and drives.
Hydraulic and Gear-Driven Systems need to keep their fluid and pressure in check. Fluid contamination, additive depletion, and wear debris are common failures. Oil analysis is the top choice for monitoring these systems.
Electrical Infrastructure like switchgear and transformers often fails due to resistance and heat. Thermal imaging cameras are the go-to for finding hotspots. They spot issues like loose connections and overloads.
Piping and Structural Assets often fail due to leaks or insulation breakdown. Ultrasound detection is very effective. It finds leaks in compressed air systems and detects corona and arcing in electrical assets.
| Asset Class | Primary PdM Technology | Key Failure Modes Detected |
|---|---|---|
| Rotating Equipment (Motors, Pumps) | Vibration Analysis & MCSA | Imbalance, misalignment, bearing faults, electrical issues |
| Hydraulics & Gearboxes | Oil Analysis | Fluid contamination, wear debris, additive breakdown |
| Electrical Systems | Thermal Imaging | Overheating connections, load imbalances, component failure |
| Piping & Compressed Air | Ultrasound | Pressure/vacuum leaks, steam trap failures, electrical arcing |
Asset criticality helps choose the right technology. Critical assets might need several monitoring methods. For example, a key pump could use vibration sensors, oil analysis, and thermal scans.
Most companies need a mix of these technologies. A good condition monitoring program isn’t about picking one tool. It’s about having the right tools for each asset class.
Wireless vs route‑based sensors; data ownership and alerts
Modern predictive maintenance programs face a key decision. Teams must pick between wireless sensors for live data or handheld devices for regular checks. This choice affects how well they operate and their future plans.
Wireless sensors are the latest technology. They stay on important equipment all the time. They send data to the cloud non-stop.
The software checks the data against what’s normal. It can make work orders by itself. This system turns data into quick actions.

Route-based collection uses handheld tools. Technicians follow a set path to get readings. This method is for thermal imaging cameras and ultrasonic leak detectors.
This method gives a snapshot of equipment health at a certain time. The data is later uploaded to maintenance software. It needs regular schedules and manual effort.
The table below outlines the core differences between these architectures.
| Factor | Wireless Sensors | Route-Based Collection |
|---|---|---|
| Deployment | Permanently installed, networked | Handheld devices on scheduled routes |
| Data Granularity | Continuous, real-time streaming | Periodic, snapshot data |
| Initial Investment | Higher upfront cost | Lower initial capital outlay |
| Scalability | Easy to expand network | Limited by technician time |
| Alert Automation | Immediate, system-generated | Delayed, often manual review |
Who owns the data is a big deal. With wireless systems, the owner keeps all the data. This data fits right into existing condition monitoring systems and CMMS software.
Route-based data might stay on devices until synced. This can make the historical record incomplete. It’s important for good predictive analytics.
Wireless networks have a big advantage: automated alerts. The system spots problems, like a faulty bearing or a hot spot from thermal imaging. It then makes a work order in the CMMS.
For route-based methods, finding a leak needs manual logging. The response time depends on the technician’s schedule. This can cause more energy waste or damage.
The choice is clear. Wireless monitoring costs more upfront but offers constant insights. Route-based collection is cheaper but relies on people’s schedules.
Companies must decide between real-time data and budget. The goal is to fix problems quickly and efficiently.
Thermal cams for hotspots; ultrasound for air/vacuum leaks and steam traps
Vibration analysis is great for finding mechanical problems. But thermal and ultrasound inspections are key for electrical and fluid systems. These methods give us a deeper look into what’s going wrong, often before it’s too late.
Infrared thermography lets us see heat patterns with special cameras. It’s top-notch for spotting electrical issues like bad connections and overloaded circuits. It also finds mechanical overheating and insulation problems.
Ultrasonic analysis picks up on high-frequency sounds from equipment. It’s great for finding energy waste in air, gas, and vacuum leaks. It also checks steam traps and valve seals. Plus, it warns us about bearing wear and lubrication issues early on.
These two methods catch problems at different times. Ultrasonic analysis finds issues like small air leaks or bearing wear early. Thermal imaging spots problems after they’ve caused a lot of heat, which is later.
For electrical issues in motors, Motor Current Signature Analysis (MCSA) is a go-to. It looks at the motor current waveform to find problems like rotor bar defects. Combining this with thermal and ultrasonic data on smart technology platforms gives us a full view of how our assets are doing.
Oil analysis for gearboxes/hydraulics; MCSA for motors/VFDs
Predictive maintenance can save a lot of money by using specific methods like oil analysis and motor current monitoring. These methods give deep insights into certain assets. They catch problems early that others might miss.
Oil analysis is a cost-effective way to check closed-loop systems. By regularly testing the fluid in gearboxes or hydraulics, you can see how well the system is working. Labs look at the fluid for signs of wear, contamination, and changes in viscosity.
Looking for wear metals like iron, copper, and aluminum can show if parts are wearing down. Finding water or dirt in the fluid means there might be a leak or seal problem. If the viscosity changes, it could mean the oil is breaking down or the wrong type was used.

This information helps predict failures before they cause big problems. For hydraulics, tracking particle counts is key. It helps avoid blockages and wear on pumps. The ROI from oil analysis comes from avoiding unplanned downtime and extending oil change intervals.
Motor Circuit Analysis (MCA) and Motor Current Signature Analysis (MCSA) work well with vibration monitoring. They check the electrical health of motors and Variable Frequency Drives (VFDs). MCA tests the insulation and stator condition offline.
Online MCSA watches the current signatures while the motor is running. It finds mechanical and electrical faults like broken rotor bars and air gap eccentricity. This makes it a natural companion to vibration analysis for motor-driven assets.
These techniques are worth the cost because they provide valuable insights. They have different uses and benefits.
| Predictive Maintenance Technique | Target Asset Class | Key Diagnostic Parameters | Primary Faults Identified | ROI Consideration |
|---|---|---|---|---|
| Oil Analysis | Gearboxes, Hydraulic Systems | Ferrous Density, Particle Count, Viscosity, Water Content | Wear Metals, Contamination, Lubricant Degradation | Prevents catastrophic bearing & gear failure; extends oil life |
| Motor Circuit/Signature Analysis (MCA/MCSA) | AC/DC Motors, VFDs | Insulation Resistance, Current Signature, Phase Imbalance | Broken Rotor Bars, Stator Faults, Electrical Imbalances | Identifies electrical issues before mechanical vibration occurs |
| Combined Approach | Motor-Driven Systems with Gearboxes | Oil Data + Current Signatures + Vibration | Comprehensive mechanical & electrical fault spectrum | Maximizes asset lifespan and optimizes maintenance scheduling |
Using oil analysis and MCSA needs to know which assets are most important. High-value gearboxes and critical motors are best. The cost of sampling kits or sensors is soon paid back.
Stopping one major failure can pay for the whole program. These methods change maintenance from just fixing problems to preventing them. They help make smart decisions about repairs or replacements.
For reliable predictive maintenance, oil analysis and motor electrical testing are key. They focus on where they add the most value. The secret is using the right tool for the right asset.
Pilot plan: 90‑day rollout and vendor scorecard
Starting a predictive maintenance program needs a clear plan. A 90-day pilot is a good start. It helps you see results quickly. Begin with important machines and use vibration and oil analysis for a wide check.
The pilot should have clear steps. First, pick a few key machines. Use sensors to collect data. Then, add this data to your CMMS, like IBM Maximo or SAP. This makes it easier to manage work orders and track progress.
Choosing the right technology partner is key. Use a scorecard to evaluate them. Look at the sensor quality and how well it integrates with your systems. Also, check the analytical software and support offered. Think about the total cost over time.
This pilot lays the groundwork for success. Focus on doing well, then grow. The first 90 days show if the program works. This approach helps your team get better and makes the program bigger.


