
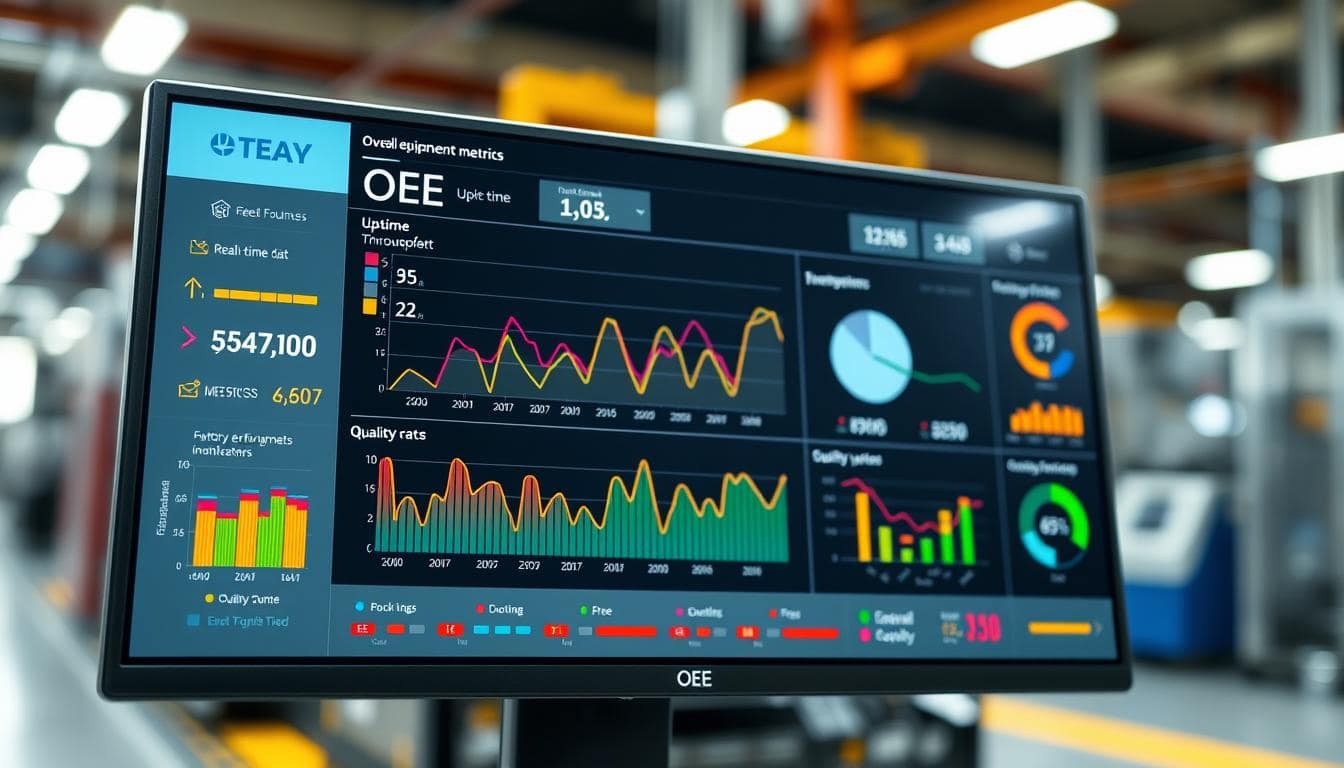
Imagine your factory floor getting a report card. It’s not the kind you dreaded in school. Instead, it’s about your Overall Equipment Effectiveness, the GPA of your industrial symphony.
This score is like manufacturing’s Rotten Tomatoes rating. It shows if your factory is playing well or just making noise.
The magic happens when you connect your PLCs, SCADA systems, and IIoT sensors. That’s where the real magic happens.
This integration turns KPIs into the vital signs of your factory. You get to see availability, performance, quality, and your “Top Losses.” They become powerful tools for improvement.
With the right data from MES to SCADA to PLCs, you get a real-time dashboard. It doesn’t just report the news. It lets you change the game.
Architecture: PLC→SCADA/MES, edge gateways, historians
Think of your factory’s data architecture like a heist movie. You have PLCs as the grunts, SCADA as the mastermind, and MES as the financier. The data is the loot, and its journey is key.
The Programmable Logic Controller (PLC) is the muscle, executing commands fast. Its language is raw and immediate.
Then, there’s the SCADA system, the supervisory command center. It watches monitors, getting a real-time view of everything. SCADA doesn’t tell PLCs what to do, but it checks if they’re doing it right.
The MES is like the producer. It takes data from the floor and makes a production schedule. It manages work orders, quality checks, and material flow.
But, no good heist is complete without specialists. This is where edge gateways and data historians come in.
An edge gateway is like a safecracker and getaway driver. It sits locally, filtering noise and translating data for the network. It’s edge computing in action, saving bandwidth and time.
The historian is the meticulous archivist. It records every data point, creating the complete story for later analysis. It’s the director’s cut.
These characters talk to each other through OPC UA. It’s the encrypted comms channel that ensures understanding. It enables a truly integrated architecture.
Choosing your architecture is like choosing your genre. It’s not just technical specs; it’s storytelling. You have options like:
- The Hierarchical Epic (Classic On-Premise): A linear, top-down tale. Data flows from PLC to SCADA to MES. It’s predictable but old-fashioned.
- The Decentralized Anthology: Multiple, independent storylines. It’s resilient but can get messy.
- The Cloud Saga: Data goes to a celestial platform for analytics. It’s great for the big picture but relies on internet.
- The Hybrid Thriller: The best of all worlds. Critical data stays on-premise, while less urgent data goes to the cloud. It’s scalable for modern factories.
Your architecture is the backbone of your data’s journey. Get it right, and your information flows smoothly. Get it wrong, and it’s a mess.
FAQ
Q: What is MQTT?
A: MQTT stands for Message Queuing Telemetry Transport. It is a lightweight, open-source messaging protocol designed for IoT (Internet of Things) applications. MQTT is used for efficient communication between devices and servers, ensuring low latency and high reliability.
Q: What are the key features of MQTT?
A: MQTT’s key features include low bandwidth usage, high efficiency, and support for both publish-subscribe and request-response messaging patterns. It also offers QoS (Quality of Service) levels to ensure reliable data transmission.
Q: How does MQTT differ from other messaging protocols?
A: MQTT is designed for IoT applications and offers low bandwidth usage and high efficiency. It is more suitable for resource-constrained devices compared to other protocols like HTTP or CoAP, which are more commonly used in web applications.
Q: What are the different types of MQTT messages?
A: MQTT messages can be categorized into three types: PUBLISH, SUBSCRIBE, and UNSUBSCRIBE. PUBLISH messages are used for sending data, SUBSCRIBE messages are used for subscribing to topics, and UNSUBSCRIBE messages are used for unsubscribing from topics.
Q: What is the role of MQTT brokers in the MQTT architecture?
A: MQTT brokers act as intermediaries between devices and servers. They manage the flow of messages, handle subscriptions, and ensure that messages are delivered to the correct recipients.
Q: What are the different QoS levels in MQTT?
A: MQTT offers three QoS levels: QoS 0 (At Most Once), QoS 1 (At Least Once), and QoS 2 (Exactly Once). These levels ensure reliable data transmission by guaranteeing the delivery of messages.
Q: What are the advantages of using MQTT?
A: MQTT offers several advantages, including low bandwidth usage, high efficiency, and support for both publish-subscribe and request-response messaging patterns. It is also designed for IoT applications and offers QoS levels for reliable data transmission.
Q: What are the disadvantages of using MQTT?
A: MQTT has some limitations, such as limited support for complex data structures and limited support for large amounts of data. It is also not suitable for applications that require high-speed data transfer.
Q: What are the use cases for MQTT?
A: MQTT is commonly used in IoT applications, such as smart home devices, industrial automation, and vehicle tracking systems. It is also used in other areas, such as healthcare, finance, and logistics.
Q: What are the best practices for implementing MQTT?
A: To implement MQTT effectively, it is important to follow best practices such as using secure connections, implementing proper authentication and authorization, and optimizing network performance. Regular monitoring and maintenance are also essential for ensuring the reliability and efficiency of MQTT applications.
Understanding ISA-95
ISA-95, also known as the “95/04” standard, is a critical framework for integrating enterprise systems with manufacturing operations. It provides a structured approach to aligning enterprise systems with manufacturing operations, ensuring seamless data exchange and efficient production processes.
Definition and Purpose
ISA-95 is designed to bridge the gap between enterprise systems and manufacturing operations. It aims to standardize the integration of these systems, enabling real-time data exchange and improving overall production efficiency. By establishing a common framework, ISA-95 facilitates the alignment of enterprise systems with manufacturing operations, ensuring that data is accurately and timely shared.
Key Components
The key components of ISA-95 include:
- Enterprise Systems: These are the backbone of any organization, encompassing various functions such as finance, human resources, and supply chain management.
- Manufacturing Operations: This refers to the production processes within a manufacturing facility, including activities like material handling, production planning, and quality control.
- Integration: ISA-95 focuses on integrating enterprise systems with manufacturing operations, ensuring that data is exchanged in real-time and production processes are optimized.
By understanding these components, organizations can effectively leverage ISA-95 to enhance their production efficiency and overall business performance.
Visualization: real-time boards, Pareto, shift reports
Data is like a script, and visualization is the movie that brings it to life. Your SCADA dashboards enable production managers to gather intelligence from multiple devices simultaneously. They turn raw numbers into a story everyone can understand.
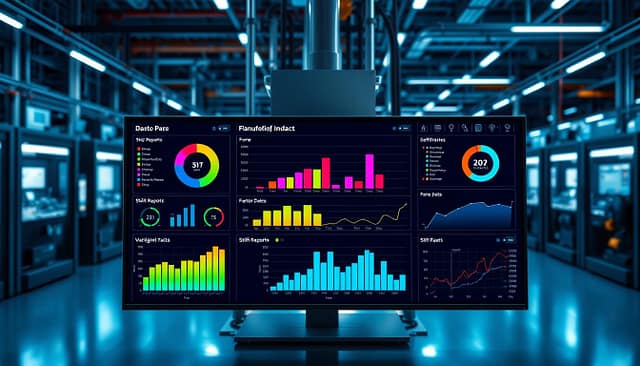
Your real-time dashboard is like a mission control center. It shows the live status of your line. A quick look tells you if you’re winning or losing the shift.
Modern systems show machine states in color. Green means it’s running, red means it’s down, and amber means it’s idle. They track performance in real-time. This makes data actionable.
The Pareto chart shows which problems are the biggest. It visually shouts which problems are the real villains. It highlights the 20% of failure modes causing 80% of downtime.
Shift reports are like a post-game recap. They give stats on the last eight hours. They show OEE, total units produced, top downtime reasons, and quality yield percentage.
A good shift report sets the stage for the next shift. It ensures everyone starts with the same facts. This leads to alignment.
But, a great visualization needs solid data. IEC 62443 standards protect that data. You wouldn’t build a control room in a war zone. Your data needs a secure foundation.
Understanding each visualization’s role is key. The table below shows the main types and their uses.
| Visualization Type | Primary Purpose | Key Metrics Displayed | Best For | Security Consideration |
|---|---|---|---|---|
| Real-Time Dashboard | Live monitoring & immediate intervention | Current OEE, machine state, production rate, active alarms | Line supervisors, cell leaders needing instant situational awareness | Requires secure, real-time data streams; vulnerable to false data injection if not protected per IEC 62443 frameworks |
| Pareto Chart | Problem prioritization & root cause analysis | Downtime reasons (descending order), defect types, loss categories | Maintenance teams, engineers, and managers focusing improvement efforts | Historical data integrity is critical; charts are only valid if source data is untampered |
| Shift Report | Performance summary & accountability | Shift OEE, total output, top losses, quality yield, schedule adherence | Shift managers, production planners, and leadership for review and planning | Reports often contain sensitive performance data; access controls and audit trails are essential |
| OEE Ticker / Andon | Floor-level communication & urgency creation | Simple OEE percentage, status light (Green/Yellow/Red), current goal | Operators and floor personnel; creates visibility and shared focus | Physical/network access to display must be controlled to prevent false signals |
When these visualizations talk to each other, magic happens. A red light on the Andon can trigger a detailed review on the dashboard. The Pareto chart, built from shift report data, informs the next day’s team huddle. This interconnected view is what OEE software delivers.
The goal is not more charts. It’s better decisions, faster. A well-designed visualization layer makes problems obvious, progress visible, and priorities clear. It turns complex data into simple insight. But always build it on a secure foundation. Let your dashboards be brilliant and your data pipelines be boringly, reliably secure. That’s how you win both the visibility battle and the security war.
Quality/Traceability: e-records, 21 CFR Part 11 considerations
In regulated manufacturing, your OEE dashboard is more than a report. It’s a legal document. For industries like pharmaceuticals and aerospace, quality data is key. It tracks every material, operator action, and environment condition.
Your machine might run well, but without proof of quality, you’re at risk. This is where data goes from optimization to risk management.
21 CFR Part 11 is the FDA’s rule for electronic records. It means your data must be immutable, traceable, and auditable. No erasing or lost documents allowed.
Your MES becomes a key player, managing data flow and adding legal proof. It tracks who did what, when, and why. This creates the immutable digital thread.
Let’s look at what this thread includes:
- Sensor readings: Temperature, pressure, and humidity.
- Operator actions: Logins, overrides, and adjustments with signatures.
- Material genealogy: Tracking raw materials through production.
- Machine states: Detailed machine modes and settings.
This isn’t just data collection. It’s building a legal case. It’s the difference between a graph and a detailed digital file.
| Aspect | Traditional Paper-Based System | Integrated Digital Quality System | Compliance Risk Level |
|---|---|---|---|
| Record Integrity | Handwritten logs, prone to loss or tampering | Electronic records with audit trails | High vs. Low |
| Traceability Speed | Days to trace a component | Seconds for traceability | Operational Crisis vs. Rapid Response |
| Batch Release Time | Manual review delays release | Automated checks enable quick release | Inventory Cost vs. Cash Flow Advantage |
| Audit Preparation | Panicked gathering of documents | Pre-configured reports ready on-demand | Stressful & Costly vs. Routine & Controlled |
| Data for OEE Dashboard | Manual entry leads to errors | Real-time, accurate data feeds | Misleading Metrics vs. Actionable Intelligence |
Notice the last row? When quality data flows into your systems, your OEE dashboard changes. It shows verified, auditable data. This is a big difference.
An operator can’t fake numbers anymore. The system tracks everything. It knows who did what and when.
This is the “Compliance Dividend.” You meet 21 CFR Part 11 and get better data. No more arguments about what happened last Tuesday. Your OEE is now solid evidence.
The rule for regulated industries is clear: If it wasn’t recorded electronically, it didn’t happen. Your system ensures everything is recorded correctly. It turns production into a science. And your dashboard becomes a shield.
Analytics: SPC, anomaly detection, predictive maintenance hooks
Analytics turns your manufacturing data into predictions. We’ve moved from just reporting what happened to predicting what might happen next. This is not magic—it’s using statistics and understanding machines.
Your data platform is like a plant’s soothsayer. It listens to your operation and predicts future problems.
Let’s look at the three main analytical tools that turn data into useful insights.
The Classics Never Die: Statistical Process Control
Statistical Process Control (SPC) is like a wise professor. It uses past data to set what’s normal. It’s like drawing lines on a basketball court to see if your process is in bounds.
SPC sets limits based on past data. If current data goes beyond these limits, it alerts you. This method is reliable, proven, and easy to understand. It asks: “Is my process acting as it should?”
The New Kid on the Block: Anomaly Detection
Anomaly detection is like a jazz musician. It learns the normal rhythm of your equipment. When something unusual happens, like a bearing singing off-key, it notices first.
This method uses machine learning to understand normal equipment behavior. It flags any unusual data in real-time. It’s great because it catches issues SPC might miss.
The Holy Grail: Predictive Maintenance
Predictive maintenance is the ultimate goal. It schedules maintenance just before failure. This turns maintenance into a science, not just a routine.
By analyzing data patterns, predictive models forecast when equipment will fail. They tell you, for example, that Pump #3 will fail in 72 hours. This gives you time to plan.
| Analytics Method | Primary Function | Data Requirements | Key Benefit | Implementation Complexity |
|---|---|---|---|---|
| Statistical Process Control (SPC) | Monitor process stability against historical limits | Historical time-series data, quality measurements | Early detection of process deviation | Low to Medium |
| Anomaly Detection | Identify abnormal equipment behavior patterns | Real-time sensor data, machine learning models | Catches novel failures SPC might miss | Medium to High |
| Predictive Maintenance | Forecast time-to-failure for specific assets | Rich sensor data, failure history, contextual metadata | Optimizes maintenance scheduling, reduces downtime | High |
The secret to advanced analytics is the predictive maintenance hooks in your data architecture. These are not physical objects but data structures that tell the whole story.
OPC UA is key here. It moves data with its entire life story attached. This rich metadata is what predictive algorithms need.
Without this context, algorithms get incomplete information. With it, they get full stories. They understand not just rising temperatures but also which part, in which machine, is causing it.
This journey changes how you operate. You stop asking “What broke?” and start asking “What might break next?” This shift saves money and changes how you see your manufacturing floor.
Cybersecurity: zones & conduits, IEC 62443 hardening, patching
Imagine your factory’s digital system without an immune system. Every signal is open to threats. In Operational Technology, a cyber attack can stop production and damage data.
Securing MES-SCADA-PLC communications is more than just adding a firewall. It involves intellectual risk assessment and strong security controls. Think of it as a castle with firewalls, watchtowers, and guarded areas, following the IEC 62443 “zones and conduits” model.
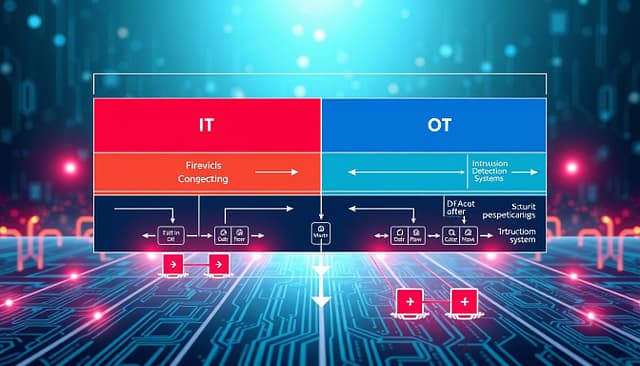
This model divides your system into trusted areas, or zones, based on importance. Your most critical systems are in Zone 1. Less critical systems are in Zone 2. The conduits control how these zones communicate, ensuring safety.
| Security Zone | Typical Assets | Security Posture | Conduit Control Example |
|---|---|---|---|
| Zone 0 (Critical Process) | Safety PLCs, Drives, Critical Sensors | Highest. No direct external access. | Unidirectional data diodes allowing only outbound data flow. |
| Zone 1 (Basic Control) | Production PLCs, HMIs, SCADA Nodes | High. Hardened configurations, minimal services. | Deep packet inspection firewalls whitelisting only OPC UA traffic. |
| Zone 2 (Supervisory) | MES Servers, Historians, Engineering Stations | Medium-High. Strict access controls, regular audits. | Application-layer gateways validating all MQTT Sparkplug payloads. |
| Zone 3 (Enterprise) | ERP, Business Networks | Standard IT security. Treated as untrusted relative to OT. | Demilitarized Zone (DMZ) with proxy services for data exchange. |
With zones set, hardening starts. This means removing unused parts and securing systems. It’s like making a digital fortress without losing functionality.
Patching is also key. It’s not just about updating systems. It’s about doing it safely and with a plan. This keeps your systems secure and running smoothly.
Protecting your IIoT messengers is also important. Use protocols like MQTT securely. This means encrypting messages and controlling who can send and receive them.
OT cybersecurity is about being proactive, not reactive. It’s about understanding that your digital and physical systems are connected. Building a strong defense is essential for a modern factory.
Rollout: pilot cell, scaling patterns, training
Think of your factory’s digital transformation like a TV series, not a movie. You start with a pilot episode before expanding. This approach avoids the disaster of sudden, large changes.
Start with a pilot cell, focusing on one production line or machine cluster. This isn’t about being small; it’s about testing in a controlled space. You can learn from mistakes without major consequences.
Tools like Cerexio’s pre-built connectors are key. They make integration easy, without needing a full system overhaul. This way, you can show quick results, not just in theory.
Your pilot should answer key questions. Does the data flow right? Can operators use the dashboards? Is the ISA-95 equipment hierarchy correct? A successful pilot is your best argument for wider use.
From Pilot Episode to Full Series: Scaling Patterns
After a successful pilot, you scale up. This isn’t just copying what worked. It’s about adapting to different machines, operators, and cultures.
Scaling should follow clear patterns:
| Approach Type | Risk Level | Time to Value | Change Management Required | Best For |
|---|---|---|---|---|
| Pilot Cell (Phased) | Low | 3-6 months for pilot | High in pilot, medium in scale | Complex environments, legacy systems |
| Big Bang (All-at-Once) | Extreme | 12+ months | Massive across entire org | Greenfield sites only |
| Parallel Run | Medium | 6-9 months | Very High (dual systems) | Mission-critical processes |
| Module-by-Module | Medium-Low | 4-8 months | Consistent, manageable | Multi-line facilities |
The pilot cell method, being ISA-95 compliant, sets a template for future rollouts. You’ve solved the tough integration issues once. Now, you’re following a proven pattern, like in scaling case packing automation.
The Human Factor: Training as Co-Authorship
Training is key. It turns people into active participants in the data story. Without it, your rollout is like a book no one can read.
Good training has three parts:
- Context Before Controls: Explain why the data matters before showing how to access it. Connect OEE metrics to job security, quality bonuses, and easier shift management.
- Hands-On with Real Data: Use actual pilot cell data for training exercises. Let operators see their own machine’s performance trends, not generic examples.
- Gradual Responsibility Transfer: Start with view-only access, then basic interactions, then full dashboard customization as confidence grows.
The ISA-95 data model makes training easier. When equipment hierarchy mirrors physical reality, operators navigate a digital twin of what they already know.
Success in your pilot cell isn’t just about OEE. It’s about operators asking data-driven questions, maintenance techs requesting reports, and supervisors using real-time boards. That’s when your rollout becomes a cultural shift.
Remember, your scaling pattern should include feedback loops. What works in Cell A might need adjustments for Cell B. The ISA-95 framework provides consistency, but local optimization is key. This isn’t about uniformity; it’s about flexibility that fits your factory’s unique needs.
Understanding IEC 62443
IEC 62443 is a set of standards for industrial automation and control systems (IACS) security. It aims to protect these systems from cyber threats. The standards are designed to ensure the security of IACS, which are critical to industrial operations.
IEC 62443 focuses on the security of IACS, including control systems, supervisory control and data acquisition (SCADA) systems, and distributed control systems (DCS). It provides guidelines for implementing security measures to protect these systems from cyber threats.
The standards cover various aspects of IACS security, including risk management, vulnerability assessment, and incident response. They also address the need for secure communication protocols and the protection of sensitive data.
By following the IEC 62443 standards, organizations can enhance the security of their IACS. This helps to prevent unauthorized access, data breaches, and other cyber threats. It ensures the reliability and integrity of industrial operations, minimizing the risk of disruptions and downtime.
Implementing IEC 62443 standards is essential for organizations operating in industries such as manufacturing, energy, transportation, and healthcare. These industries rely heavily on IACS to manage and control their operations. By adhering to these standards, organizations can protect their critical infrastructure and maintain the safety and efficiency of their operations.
Overall, IEC 62443 plays a vital role in ensuring the security of industrial automation and control systems. By following these standards, organizations can mitigate cyber threats and maintain the reliability and integrity of their operations.
Benefits of IEC 62443
Implementing IEC 62443 standards offers several benefits for organizations:
- Enhanced security: IEC 62443 provides guidelines for implementing robust security measures to protect IACS from cyber threats.
- Reduced risk: By following these standards, organizations can minimize the risk of unauthorized access, data breaches, and other cyber threats.
- Reliability and integrity: IEC 62443 ensures the reliability and integrity of industrial operations by protecting critical infrastructure and preventing disruptions.
- Compliance: Adhering to IEC 62443 standards demonstrates a commitment to security and compliance, which can enhance an organization’s reputation and credibility.
By implementing IEC 62443 standards, organizations can ensure the security and reliability of their industrial automation and control systems, protecting their operations and minimizing the risk of cyber threats.


