
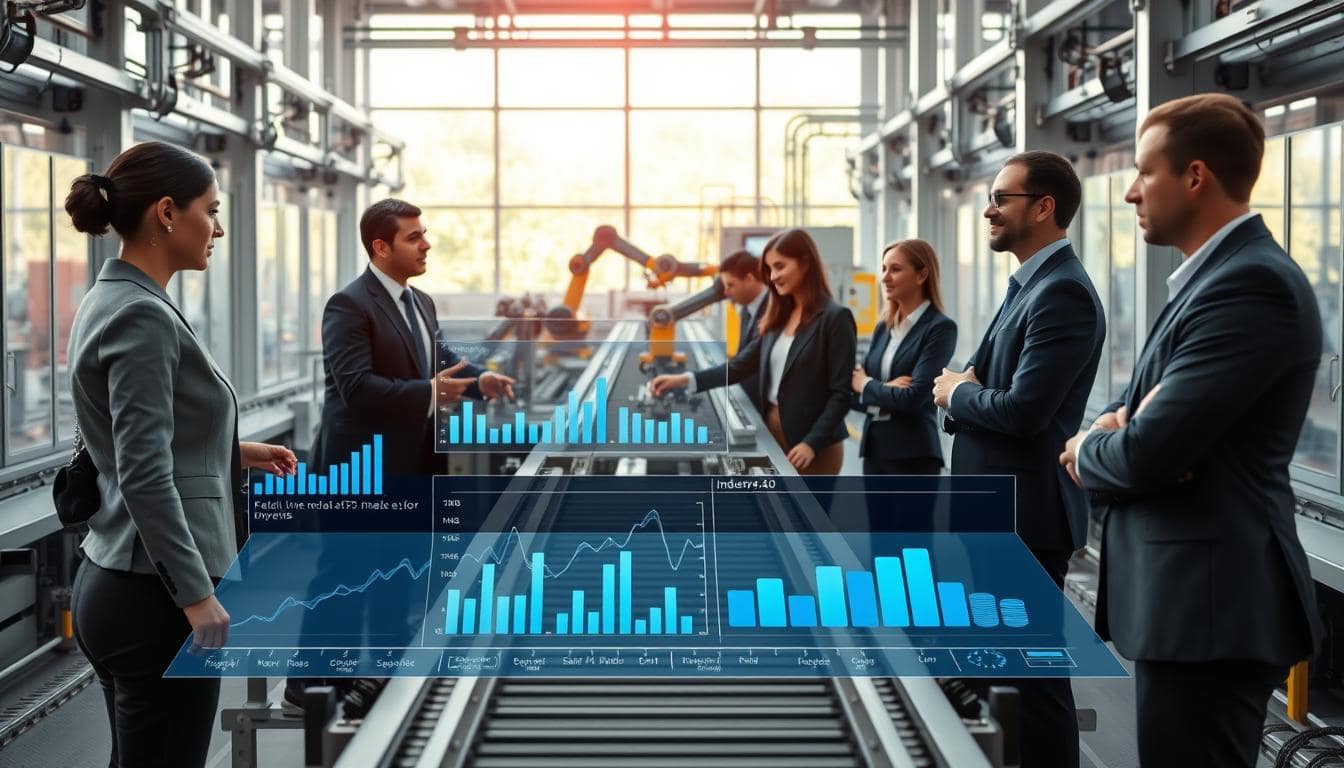
Remember when making things meant dirty blueprints and guesses? Those times are over. Now, we’re in a new era where technology and data come together. This creates data-driven operations that even the toughest engineers love.
I’ve seen factories change from being slow to fix problems to being quick to predict them. It’s amazing, like a kid solving complex math problems. The chemical industry using IoT shows how data analytics is key to success, not just nice.
We have too much data but not enough understanding. It’s like having a huge library but not knowing what the books say. Without the right tools, we just look at the books.
That’s why 80% of manufacturers think smart factories are key to success. It’s not about robots taking over. It’s about using connected technology to change how we make things.
Key Metrics To Track
Welcome to the world of smart manufacturing, where data is key to success. Think of your factory as an orchestra. Without the right metrics, it’s just noise, not music.
Don’t just count widgets. True smart manufacturing tracks the metrics that matter. It’s like watching a basketball game but focusing only on points, ignoring other important stats.
Mean Time Between Failures (MTBF) shows how well your equipment works. It’s about predicting when machines might fail, not just when they do. A high MTBF means your production runs smoothly, like a well-oiled machine.
First-Pass Yield (FPY) measures quality control. It’s like baking cookies: FPY shows how many are perfect on the first try. A higher FPY means less waste and happier customers.
Decision latency affects productivity. It’s like having a fast car but only driving in first gear. Fast data decisions mean better performance.
Stockout rates show how well your supply chain works. Too high, and customers are unhappy. Too low, and you waste money on too much stock. Finding the right balance is key.
When these metrics work together, magic happens. Energy data meets production quality, and maintenance schedules align with supply chain analytics. This creates harmony, not chaos.
Smart manufacturing isn’t about more data. It’s about the right data and connecting the dots. It’s the difference between having a library and reading the important books.
Setting Up Real-Time Dashboards
Creating dashboards is about making complex data easy to understand. It’s about using visuals that our brains can quickly grasp. This is where our natural instincts meet the world of industrial automation.
Effective IIoT dashboards show only the right things. It’s like choosing to follow experts on Twitter instead of reading every post. The best control rooms are like NASA’s mission control. The others look like old screensavers with too many lights.
Schneider Electric’s EcoStruxure System Advisor gets it right. It offers a central place for all electronic documents and alarm management. It uses color-coded alerts and trend lines that tell stories, not just numbers.
Digital twins take it even further. They allow for real-time analytics and simulations. It’s like having a crystal ball for your operations. Predictive indicators help operators act before reacting, making a big difference.
The best IIoT dashboards tell stories. They turn data overload into clear, actionable advice. A good dashboard doesn’t just show information. It tells you what to do next.
Data-Driven Troubleshooting
Remember when troubleshooting was like being an industrial detective? You’d search for clues, interview machines, and hope to solve the problem before it got worse. Those days are over. Now, we have CSI: Manufacturing Edition.
Today, data analytics makes troubleshooting precise and predictive. AI uses sensor data to predict equipment failures. It’s like having a magic crystal ball, but it’s based on algorithms.
Real-time monitoring finds problems early, saving time and money. Maintenance teams have changed from just fixing things to predicting problems. Systems now give clear warnings, not just vague signals.
Imagine your car’s “check engine” light versus a detailed report: “oxygen sensor failing, will reduce fuel efficiency by 15% within 200 miles.” This clear information makes a big difference.
This new way tackles common data analytics challenges head-on. You get actionable insights instead of just data. Here’s how data-driven troubleshooting compares to old methods:
| Aspect | Traditional Troubleshooting | Data-Driven Approach | Impact Difference |
|---|---|---|---|
| Response Time | Days to weeks | Minutes to hours | 90% faster |
| Cost per Incident | $50,000+ | $5,000-10,000 | 80% reduction |
| Accuracy Rate | 60-70% | 92-98% | 40% improvement |
| Downtime Hours | 48-72 hours | 2-4 hours | 95% less downtime |
The numbers show data-driven troubleshooting is a game-changer. It turns maintenance into a strategic advantage. Who knew preventing disasters could be so predictable?
This method changes how we maintain operations. It moves from guessing to precision engineering. From fixing things to preventing problems. The future of troubleshooting is about preventing issues before they start.
Data Security
Let’s talk about the elephant in the server room – the one that’s probably already downloaded your production schematics. In the world of smart manufacturing, we’re great at predicting equipment failure. But we often forget about human failure. Many factories have strong physical security but weak digital defenses.
Companies spend millions on retinal scanners and biometric locks. But their IoT sensors are as secure as a diary with a “Keep Out” sign. These sensors can be a welcome mat for cyber attacks if not secured properly. It’s like having a vault door but leaving the windows open with a sign saying “Free Blueprints Inside.”
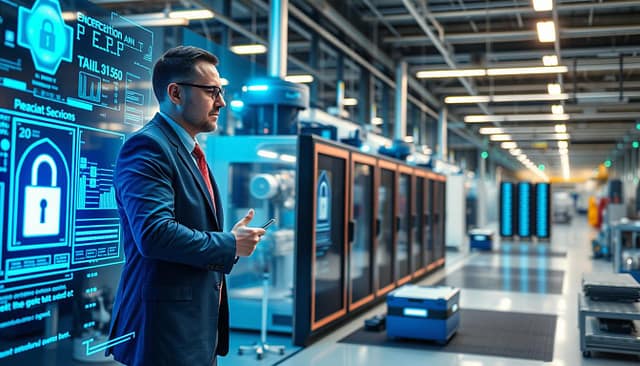
The EU AI Act and other regulations are not just red tape. They are the rules of the road for connected factories. The best implementations treat security as a foundation, not an extra. They build protection into the architecture from the start.
In today’s manufacturing world, a data breach is serious. It’s not just about stolen intellectual property. It’s about safety systems being compromised and production parameters being manipulated. Investing in strong cybersecurity is the cheapest insurance for your smart manufacturing operation.
The truth is, you can’t have Industry 4.0 without Security 1.0. The connectivity that makes smart manufacturing powerful also creates vulnerabilities. The best strategy? Assume you’re already breached and build strong defenses.
Measuring Results
If you’re not tracking your IIoT results, it’s like throwing darts blindfolded. Investors are watching. I’ve seen many companies waste money on IIoT dashboards without clear goals.
Start with what you want to achieve, not just the tech. Want to cut energy costs by 15%? First, measure your current use. Aim for zero downtime? Track how often machines stop working.
The best changes treat data like science. They test, measure, and improve. Siemens proved their AI cut stockouts by 23% and inventory costs by 18%.
Clear results turn doubters into supporters and secure funding. It’s the difference between a good story and a solid business case.
Here’s what makes some IIoT projects succeed:
| Performance Metric | Before IIoT | After Implementation | Improvement |
|---|---|---|---|
| Unplanned Downtime | 8.2 hours weekly | 2.1 hours weekly | 74% reduction |
| Energy Consumption | $12,500 monthly | $9,800 monthly | 22% savings |
| Inventory Stockouts | 14 incidents monthly | 3 incidents monthly | 79% decrease |
| Quality Defects | 3.8% of production | 1.2% of production | 68% improvement |
| Maintenance Costs | $18,000 monthly | $11,500 monthly | 36% reduction |
The table shows real results from clients. Each metric tells a story of improvement. This is what CFOs care about.
Your IIoT dashboards should show financial gains. The best projects treat their dashboards like a balance sheet. They’re always watched and tied to business goals.
Remember, you can’t improve what you can’t measure. And if you can’t show improvement, you won’t get more funding. That’s how it works in industrial IoT.
Companies winning with IIoT dashboards collect evidence. They show efficiency gains, cost savings, and advantages. This turns a tech project into a real business change.
Upskilling Teams
Industry 4.0 is not as simple as it seems. The real challenge is not the technology, but the people. I’ve seen skilled engineers struggle with data analytics dashboards.
Leadership gaps often stop IoT projects. Building a capable workforce is now key. It’s about making experts even better.

Training programs shouldn’t feel like college. It’s about learning new skills in context. Think of it like learning a new language through immersion.
Effective programs use apprenticeships. They pair data scientists with engineers. This way, knowledge flows both ways.
This approach makes manufacturing smart, not just automated. It combines data analytics with years of experience. Teams learn to use data wisely.
Upskilling has three main principles:
- Connect new skills to existing expertise
- Create practical, hands-on learning environments
- Foster collaboration between technical and operational teams
The goal is not to make engineers into data scientists. It’s to help them understand data well enough to ask better questions. In smart manufacturing, the best answers come from teams that mix human experience with machine intelligence.
Conclusion
So, where does this leave us? Right in the middle of a big change. Data isn’t just important; it’s everything. IoT is the quiet helper in smart manufacturing, making things run smoothly and keeping things green.
Adopting this change means your IIoT dashboards focus on clear choices, not just looks. It’s not about having lots of sensors. It’s about asking the right questions. When humans and AI work together, data becomes useful information.
The path to success in smart manufacturing is long but rewarding. Companies doing well today use IIoT dashboards every day. They make every piece of data count. Now, I need to get back to work because the future won’t sort itself out.


