

Most businesses rely on guesswork and hope. They drive with a foggy windshield, unsure of their path. It’s a mix of tribal knowledge and luck.
Inefficiency grows in this fog. It’s a hidden cost that slows things down. You can’t fix what you can’t see.
A good process analysis is like a defroster. It’s not just for pretty charts. It’s about understanding your operations.
It turns vague ideas into clear steps. It’s like an autopsy to make things better. The aim is to clear the fog and make things smoother.
Why do this? It’s about being honest with yourself. It leads to a better, faster way of working. It turns guesses into plans.
Tools for Process Mapping
The modern workflow mapping toolkit has split into two camps: artists and archaeologists. Artists design the perfect process from scratch. Archaeologists dig into the messy reality in your software. Your choice shows your love for truth, not just your budget.
Artists use tools like Lucidcharts and Microsoft Visios. They’re like giant whiteboards for teams to sketch processes. It’s creative but often a work of fiction.
Why? Because you’re drawing what people think happens. Sales reps say they send contracts fast. Managers claim approvals are quick. These tools help build consensus but are not always true.
Archaeologists use process mining software. It looks at your ERP and CRM logs to see real paths. It’s like a black box in your business.
Task mining observes every user action. It’s like forensic science for workflow mapping. The results show your real chaos, not a pretty picture.
So, which camp should you join? The answer is both. You need artists for the future and archaeologists for the present. The table below shows the difference.
| Approach | Key Tools & Methods | Best For | Primary Output |
|---|---|---|---|
| Diagramming & Design | Lucidchart, Microsoft Visio, Miro; collaborative workshops | Designing future-state processes, building team alignment, initial visualization | Clean, idealized process diagrams and flowcharts |
| Intelligent Discovery | Process mining (Celonis, UiPath), task mining, process intelligence | Uncovering real, as-is processes, identifying hidden bottlenecks, data-driven analysis | Data-heavy process maps, variant analysis, performance metrics |
| Hybrid Reality | Using discovery data to inform design sessions in diagramming tools | Bridging the gap between reality and ambition, creating achievable improvement plans | Realistic future-state maps grounded in operational truth |
| The Bottom Line | Diagramming tools tell you the story you want to hear. Discovery tools tell you the story your data is screaming. Smart organizations listen to both. | ||
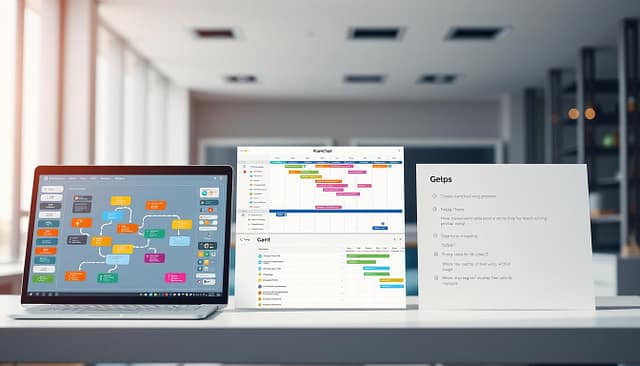
Start as an artist with Lucidchart or Miro. Map what your team believes. Then, bring in the archaeologists for a dose of humility.
Invest in a process mining proof of concept. Analyze a critical workflow like order-to-cash. The gap between your diagram and reality will be enlightening.
This isn’t just about tools. It’s a mindset. Do you want to draw your process or discover it? The former is persuasion. The latter is courage. True workflow mapping requires looking at data, even when it’s hard.
So, put down the dry-erase marker. Or use it to sketch the future after understanding the present. Your processes will thank you.
FAQ
Q: What is a bottleneck in a business?
A: A bottleneck in a business is a point in the production process where the output is limited by a single resource or step. This can lead to inefficiencies and delays in the overall production process.
Q: How can I identify bottlenecks in my business?
A: To identify bottlenecks in your business, you can analyze your production process and look for areas where resources are being underutilized or where there are inefficiencies. You can also use tools such as process mapping and data analysis to identify bottlenecks.
Q: What are some common bottlenecks in businesses?
A: Some common bottlenecks in businesses include limited resources, inefficient workflows, and outdated technology. These bottlenecks can hinder productivity and efficiency in the production process.
Q: How can I address bottlenecks in my business?
A: To address bottlenecks in your business, you can implement strategies such as resource optimization, workflow improvements, and technology upgrades. By addressing these bottlenecks, you can increase productivity and efficiency in your production process.
Q: What are some strategies for addressing bottlenecks?
A: Some strategies for addressing bottlenecks include resource optimization, workflow improvements, and technology upgrades. By implementing these strategies, you can increase productivity and efficiency in your production process.
Q: How can I optimize resources to address bottlenecks?
A: To optimize resources and address bottlenecks, you can analyze your production process and identify areas where resources are being underutilized. You can then allocate resources more effectively to improve productivity and efficiency.
Q: How can I improve workflows to address bottlenecks?
A: To improve workflows and address bottlenecks, you can analyze your production process and identify areas where inefficiencies exist. You can then implement workflow improvements, such as streamlining processes or implementing automation, to increase productivity and efficiency.
Q: How can I upgrade technology to address bottlenecks?
A: To upgrade technology and address bottlenecks, you can assess your current technology infrastructure and identify areas where outdated or inefficient technology is hindering productivity. You can then invest in technology upgrades, such as new software or equipment, to improve efficiency and productivity.
Q: What are the benefits of addressing bottlenecks in my business?
A: Addressing bottlenecks in your business can lead to increased productivity and efficiency in your production process. By optimizing resources, improving workflows, and upgrading technology, you can streamline your production process and improve overall performance.
Prioritizing Issues
Finding bottlenecks is like finding leaks in a ship. The skill is knowing which one will sink you first. You’ve mapped your process and found the choke points. Congratulations, you’ve diagnosed the disease. Now, it’s time for triage.
Not all bottlenecks need the same attention. The squeaky wheel gets grease, but a cracked axle can sink the car. Good process mapping finds problems, but smart prioritization decides which ones to fix first.
You need to think clearly and ask tough questions. Is this bottleneck stopping revenue today? Is it creating regulatory risk tomorrow? Is it slowly killing employee morale?
Quantify everything. How many hours are lost? What’s the cost of delay? What’s the error rate? Data turns emotional reactions into strategic decisions. A manual data entry step with a 15% error rate might be quieter than a manager yelling about slow reports. But which one costs more?
Use this prioritization matrix to bring clarity to your process mapping efforts:
| Bottleneck Type | Immediate Impact | Strategic Leverage | Priority Score |
|---|---|---|---|
| Revenue Blockers | Direct cash flow interruption | High – fixes show immediate ROI | 9/10 |
| Quality Degraders | Customer dissatisfaction, returns | Medium-High – protects brand value | 8/10 |
| Morale Killers | Turnover, disengagement | Medium – affects long-term capacity | 6/10 |
| Compliance Risks | Potential fines, legal exposure | High – non-negotiable requirements | 9/10 |
Now, find the root causes. Don’t just treat symptoms. Is the bottleneck in materials, information, or decision-making? Look beyond your four walls. Could your supply chain vendor be the real culprit? External factors love to masquerade as internal problems.
Human factors matter a lot. Don’t reduce people to mere “resources” in your process mapping. Skills gaps, burnout, and poor training are real, human-shaped bottlenecks. That veteran employee who manually reconciles spreadsheets? They’re not a bottleneck—they’re a symptom of a broken system.
Beware the classic pitfalls. First, ignoring small bottlenecks that aggregate into major constraints. Second, neglecting variability—a process that works fine 29 days a month but collapses on the last day is broken. Third, lacking complete data and making decisions on anecdotes.
Process mapping without prioritization is like having a map without a destination. You’ve charted the territory, but you’re not actually going anywhere. Strategic prioritization creates leverage. It applies pressure where movement creates the most downstream benefit.
Remember: you’re not just fixing a problem. You’re solving the right problem. The bottleneck that, when cleared, unlocks five others. That’s the magic of intelligent process mapping—it turns constraints into catalysts.
Your process map is now a strategic document. It tells you not just what’s broken, but what to fix first. It transforms overwhelming complexity into actionable sequence. That’s how you move from diagnosis to cure.
Real-World Examples
If process mapping were a movie, these real-world examples would be the Oscar-winning scenes of corporate dysfunction. They show how theoretical bottlenecks manifest in actual workplaces, often wearing clever disguises.

Take the monthly financial report that’s always late. Everyone points fingers at the analyst. Our process mapping uncovered the truth: three separate software systems that don’t talk to each other. The analyst wasn’t slow; they were translating digital data for eight hours each month.
The fix wasn’t a pep talk. It was a $5,000 software integration that saved 96 hours of annual labor.
Creative agencies face a classic external bottleneck: client feedback. Projects stall for weeks waiting for notes. Mapping the communication flow showed the problem. Sending 50 designs at once creates decision paralysis.
The solution? Batched submissions with a single, clear feedback tool. Wait times dropped by 60%. Sometimes the bottleneck isn’t the client; it’s how you ask.
Then there’s corporate amnesia. Two departments independently researched the same market trend. Neither knew about the other’s work. Process mapping the information flow showed the knowledge silos.
It was the business equivalent of buying the same book twice because you forgot you owned it. The solution was a simple shared digital library, saving $15,000 in duplicate research costs.
The most delicate bottleneck wears a tie and has an office. The micromanager. Our workflow mapping showed a decision node with a 48-hour loop labeled “final approval.” For items already approved by department heads.
This wasn’t a process issue; it was a trust issue disguised as quality control. The solution involved diplomatic conversations (and possibly HR documentation).
| Bottleneck Scenario | Root Cause | Band-Aid Fix | Real Solution |
|---|---|---|---|
| Late Financial Reports | Non-integrated software systems | Hire temporary help | Implement system integration |
| Slow Client Feedback | Communication overload | Send reminder emails | Batch submissions with clear tools |
| Duplicate Market Research | Information silos | Cross-department meetings | Create shared knowledge base |
| Approval Delays | Micromanagement culture | Work overtime | Establish clear decision authority |
These aren’t edge cases. They’re Tuesday. What makes process analysis powerful is how it reframes personal failure as system failure. The overworked analyst isn’t incompetent. The departments aren’t territorial. They’re all responding rationally to broken processes.
Mapping processes turns finger-pointing into problem-solving. It reveals that the “people problem” is usually a design problem in disguise. The next time you face a recurring issue, don’t ask who’s failing. Ask what system is making failure the rational choice.
FAQ
Q: What is process mapping?
A: Process mapping is a visual representation of a process that shows how tasks are connected and flow from one to another. It helps identify inefficiencies and opportunities for improvement.
Q: Why is process mapping important?
A: Process mapping is important because it helps identify inefficiencies and opportunities for improvement. It allows for the visualization of processes, making it easier to understand and optimize them.
Q: What are the different types of process maps?
A: There are several types of process maps, including flowcharts, swimlane diagrams, and value stream maps. Each type serves a specific purpose and can be used to visualize different aspects of a process.
Q: How can process mapping help with process improvement?
A: Process mapping helps identify inefficiencies and opportunities for improvement by visualizing the flow of tasks and processes. It allows for the analysis of each step and the identification of areas for optimization.
Q: What are the benefits of process mapping?
A: Process mapping offers several benefits, including improved efficiency, reduced waste, and enhanced collaboration. It helps streamline processes, reduce errors, and improve overall productivity.
Q: How can process mapping be used in different industries?
A: Process mapping can be used in various industries, including healthcare, manufacturing, and finance. It helps optimize processes, improve efficiency, and enhance overall performance.
Q: What are some best practices for process mapping?
A: Some best practices for process mapping include using standardized symbols and notation, involving stakeholders in the mapping process, and regularly reviewing and updating the maps. These practices ensure accurate and effective process mapping.
Q: How can process mapping be used for continuous improvement?
A: Process mapping can be used for continuous improvement by identifying areas for optimization and implementing changes. It helps create a culture of improvement and encourages ongoing process refinement.
Q: What are some real-world examples of process mapping?
A: Process mapping has been successfully implemented in various industries, including healthcare, manufacturing, and finance. These examples showcase the effectiveness of process mapping in improving efficiency and optimizing processes.
Q: How can process mapping be integrated into a business strategy?
A: Process mapping can be integrated into a business strategy by aligning it with overall goals and objectives. It helps optimize processes, improve efficiency, and enhance overall performance.
Q: What are the benefits of process mapping?
A: Process mapping offers several benefits, including improved efficiency, reduced waste, and enhanced collaboration. It helps streamline processes, reduce errors, and improve overall productivity.
Q: How can process mapping be used for continuous improvement?
A: Process mapping can be used for continuous improvement by identifying areas for optimization and implementing changes. It helps create a culture of improvement and encourages ongoing process refinement.
Q: What are some real-world examples of process mapping?
A: Process mapping has been successfully implemented in various industries, including healthcare, manufacturing, and finance. These examples showcase the effectiveness of process mapping in improving efficiency and optimizing processes.
Q: How can process mapping be integrated into a business strategy?
A: Process mapping can be integrated into a business strategy by aligning it with overall goals and objectives. It helps optimize processes, improve efficiency, and enhance overall performance.
Conclusion
So, where does this journey end? Think of process mapping as a new way to see your operation. It’s the difference between guessing why things are slow and knowing exactly what’s holding you back.
We started by wondering why we need to map at all. The answer is clear: you can’t fix what you can’t see. Good process mapping makes things visible, turning vague problems into clear targets. Tools like flowcharts and value stream maps help you describe your workflow’s real state, not just what you wish it was.
Identifying bottlenecks is the first step after scanning. Then, you prioritize them. Real-world examples show this isn’t just theory. It’s the hard work of making things run smoothly. Keeping an eye on things ensures the fixes last, turning a project into a habit.
This whole process starts with that first map. A clear visual document, like those in business process mapping guides, turns confusion into a clear plan. It shows where things go wrong, where decisions slow down, and where resources are wasted.
The benefits go beyond just being more efficient. It’s about empowerment. You move from reacting to chaos to designing your workflow. You go from being a passenger to the driver. That shift, from passive to active, is where the real work—and fun—starts.


