

In industrial settings, the mechanical state of custom rotating machinery is key. The oscillation of components shows the machine’s health. This motion is not just random noise but a detailed data stream.
When left unmanaged, too much oscillation cuts down efficiency. It speeds up wear and can cause big mechanical failures. This leads to costly downtime for any operation.
In predictive maintenance, this motion is seen as the machine’s vital sign. Each asset has a unique signature when it’s healthy. Any changes from this baseline are early signs of trouble.
Vibration analysis turns raw motion into useful data for maintenance teams. This data helps teams make proactive decisions. They can act based on clear evidence of asset condition.
Good condition monitoring turns machine behavior into a reliable health check. It’s essential for any modern maintenance strategy.
Instruments: Route Data Collectors vs Wireless Sensors; Placement and Safety
There are two main ways to collect vibration data: route-based collectors and wireless IIoT sensors. Each method affects data quality, how often you can monitor, and safety. We’ll look at the differences and how to install sensors for spectrum analysis.
Before, people used handheld devices to check machines at set points. This method had gaps in data, missing some faults.
Manual collection can be risky. Mistakes in how the probe is placed or pressed can change readings. Also, it’s dangerous to get close to running machines.
Now, we use wireless sensors like the NCD Gen4 for constant monitoring. These sensors send data all the time without needing someone to check them.
These smart sensors do some work on their own. They only send alerts when something is really wrong. This saves battery and network use.
The table below shows the main differences between these two ways to get data.
| Feature | Route Data Collectors | Wireless IIoT Sensors |
|---|---|---|
| Monitoring Type | Periodic / Snapshot | Continuous / 24/7 |
| Data Gap | High risk between readings | Minimal to none |
| Human Intervention | High (technician required) | Low (after installation) |
| Safety Risk | High for personnel | Low after installation |
| Ideal Use Case | Baseline surveys, infrequent checks | Critical assets, predictive programs |
Getting sensors right is key for good spectrum analysis. The sensor must be near the bearing to get the best data. This is where the most vibration comes from.
The surface for the sensor must be clean and flat. It should be free of paint or dirt. The sensor must be pointed correctly to get the right data.
For the best data, sensors should be mounted on studs. Epoxy is a good choice if drilling is not possible. But magnetic mounts might not catch high-frequency vibrations well.
When installing sensors, safety is very important. Technicians must follow safety rules and use the right gear. This is to avoid accidents.
In short, moving to wireless sensors improves data and safety. But, the quality of the data depends on how well the sensors are placed and mounted. These steps are essential for finding faults and doing spectrum analysis well.
Fault Fingerprints: Imbalance, Misalignment, Looseness, Bearings, Gears, Resonance (Symptoms and Fixes)
Each machinery fault has a unique vibrational signature, like a fingerprint. Analysts can decode this. Vibration analysis turns raw data into actionable diagnoses by matching frequency patterns to known mechanical conditions.
This systematic approach is key to effective predictive maintenance.
Understanding both time-domain waveforms and frequency spectra is essential. The following breakdown details the characteristic symptoms and standard corrective actions for the most common faults in custom rotating equipment.
Common Fault Signatures and Corrections
| Fault Type | Primary Frequency | Key Symptoms | Corrective Action |
|---|---|---|---|
| Imbalance | 1x Running Speed (RPM) | High radial vibration at 1x RPM. Phase is stable. Vibration increases with speed squared. | Dynamic balancing. Adding or removing mass from the rotor. |
| Misalignment | 1x & 2x RPM (Axial) | High axial vibration. Often shows 180° phase difference across couplings. | Precision laser shaft alignment. |
| Mechanical Looseness | Multiple Harmonics | “Haystack” spectrum with many harmonics. Can cause sub-harmonics (1/2x, 1/3x RPM). | Bolt tightening, foundation repair, or component reseating. |
| Bearing Faults | BPFO, BPFI, FTF, BSF | High-frequency peaks with sidebands. Increasing noise floor. “Envelope” analysis reveals impacts. | Lubrication, bearing replacement, or addressing improper installation. |
| Gear Mesh Faults | Gear Mesh Frequency (GMF) | High vibration at GMF and harmonics. Sidebands at shaft speed indicate wear. | Profile correction, tooth grinding, or gear replacement. |
| Resonance | Natural Frequency | Sharp peak at a fixed frequency. Amplitude changes dramatically with small speed changes. | Add stiffness/dampers, change support, or avoid the critical speed. |
Imbalance results from uneven mass on the rotor. It’s the most common fault. The dominant vibration is at the machine’s speed (1x RPM). The amplitude grows with the square of the speed.
To fix it, perform a dynamic balance to redistribute mass.
Misalignment happens when shafts aren’t straight. It causes strong axial vibration at 1x and 2x RPM. The phase across the coupling is a key indicator. To correct it, use laser or dial indicator methods for precise realignment.
Mechanical Looseness includes loose bolts or poor fits. It creates a “haystack” spectrum with many harmonics. It can also cause sub-synchronous vibrations. Secure the loose component to solve the problem.
Bearing faults produce specific frequencies based on bearing geometry. These include BPFO and BPFI. Cage frequency (FTF) and ball spin (BSF) are also key. Early-stage bearing faults produce high-frequency energy and sidebands around bearing frequencies.

As damage progresses, these frequencies increase in amplitude. Envelope or demodulation analysis is critical for early detection. Corrective actions range from re-lubrication to full bearing replacement, depending on severity.
Gear Mesh Faults are identified by vibration at the Gear Mesh Frequency (GMF). GMF equals the number of teeth multiplied by the shaft speed. Wear or damage creates sidebands around GMF at the shaft speed. Fixes involve correcting the tooth contact pattern or replacing the gear set.
Resonance is a condition, not a fault. It happens when an operational force excites a component’s natural frequency. This leads to amplified vibration, often at a non-synchronous frequency. The solution is to detune the system by adding stiffness, mass, or damping, or by avoiding the problematic speed range.
Accurate diagnosis requires correlating frequency data with these known fingerprints. This direct link between symptom and fix enables timely, cost-effective repairs. It prevents unnecessary downtime and component replacement.
Setting Alarm Bands and Trending Rules in CMMS/PI System
A vibration monitoring program shines when it links with maintenance systems through set thresholds. This step turns raw sensor data into useful maintenance insights in CMMS or PI systems.
To integrate well, start with a solid baseline for each machine. Technicians gather vibration data under normal conditions over time. This data acts as a performance fingerprint for the asset.
This baseline is key for future measurements. With it, teams can set up smart alarm bands. These bands guide maintenance actions clearly.
Alarm bands have three levels: Alert, Warning, and Critical. Each level prompts a specific response. Thresholds are set based on ISO standards for industrial machines.
| Alarm Tier | Threshold Basis | Typical Response | Example Fault Flag |
|---|---|---|---|
| Alert | 15-25% above baseline or ISO “Good” limit | Monitor trend; schedule inspection | Early bearing wear |
| Warning | ISO “Satisfactory” to “Unsatisfactory” limit | Plan corrective work order | Moderate misalignment |
| Critical | ISO “Unacceptable” limit | Immediate shutdown and repair | Severe imbalance or looseness |
Setting alarm bands is just the start. Trending rules add a vital layer of insight. These rules track changes in vibration data like Velocity RMS.
A slow increase in vibration usually means normal wear, like bearing wear. But a sudden spike means a serious issue, like an impact. Modern systems can track both the value and rate of change in vibration.
Using historical data helps fine-tune these settings. Over time, the system learns the machine’s true behavior. This reduces false alerts and ensures teams only get important notifications.
Connecting with IIoT platforms sends data straight to CMMS. This automation makes maintenance more efficient. Key benefits include:
- Automated work order generation when alarms are breached.
- Real-time dashboards for asset health.
- Historical data for reliability engineering and root cause analysis.
Well-set alarm bands and trending rules turn data into clear maintenance actions. They create a framework for predictive maintenance, saving costs.
Case Example: From High 1× to Balanced Rotor—Time/Cost Saved
A 9-ton pump at Hazleton Pumps had severe vibration. The first thought was a long and expensive fix. The pump ran at 800 RPM, and the vibration was a big worry.
Experts thought it might be misalignment or imbalance. They suggested big changes to the pump’s base and support. This plan would cost $40,000 per pump and require a lot of downtime.
But the team chose a different path. They used a cloud-based tool, SimScale, for a detailed analysis. This tool showed a key issue.
The pump’s natural frequency was 780 RPM, very close to its running speed. This caused resonance, making the vibration worse. It wasn’t just misalignment or a rotor problem.
They found a way to fix it without spending a lot. They changed how the pump was run to avoid the bad frequency. They also added support to the subframe to make it stiffer.
This smart plan saved a lot of money. It was a fraction of the cost of the original plan. The pump’s vibration went down, and it lasted longer.
Hazleton Pumps saved a lot of money and avoided downtime. This shows how important it is to find the real problem. It’s not just about fixing symptoms.
This story is a great example of why investing in analysis tools is smart. It saved time and money by figuring out the real issue. It’s a strong argument for those who want to improve their maintenance and reliability.
When to Escalate to OEM or Analyst
Knowing when to ask for help is key to keeping things running smoothly. This includes knowing when to call in experts. It’s about when problems are too big for your team to handle alone.
Most of the time, your team can fix simple issues like imbalance. But, if problems are too complex, it’s time to bring in the pros. This ensures you get the best help for the job.
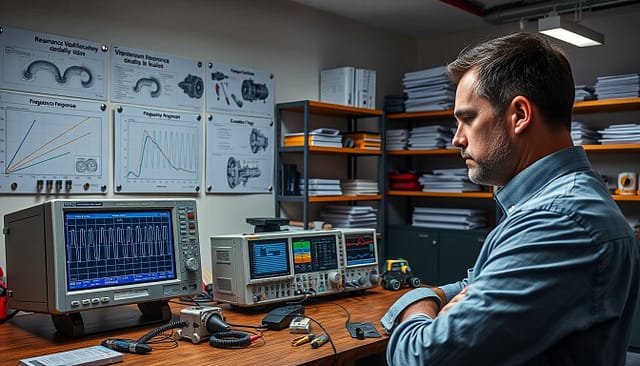
One big reason to ask for help is if you think something is resonating. Resonance happens when a machine vibrates at the same frequency as its natural frequency. This can cause serious damage.
Fixing resonance needs special skills. Your team might spot the problem, but fixing it needs a pro. A certified vibration analyst can do the detailed work needed. They use special tools to understand the machine’s behavior.
Other tricky problems also need outside help. This includes things like rotor rubs and aerodynamic issues. Even problems with the drivetrain can be too much for your team.
| Scenario | Key Indicators | Recommended Escalation Path |
|---|---|---|
| Suspected Structural Resonance | Vibration peaks at a fixed frequency regardless of speed; high amplification at specific RPMs. | Category III/IV Analyst for modal analysis and FEA simulation. |
| Persistent, Unidentified Fault | High vibration remains after correcting imbalance, alignment, and looseness; symptom pattern is ambiguous. | OEM or senior analyst for forensic data review and advanced diagnostics. |
| Failure Under Warranty | Component or system failure within the warranty period; root cause analysis is required for claim. | OEM engineering team for official failure analysis and documentation. |
| Pre-Modification Assessment | Planning a retrofit, speed change, or significant load alteration on existing equipment. | OEM or consultant to assess possible new resonance or dynamic response issues. |
Warranty issues are another reason to call in the experts. The OEM needs to confirm a failure to keep your warranty valid. Their help ensures everything is done right.
Also, if you’re planning to change your equipment, think about getting help. Changing how it works can cause new problems. The OEM knows how to predict these issues.
Getting experts means you get top-notch tools and analysis. This is key for fixing big problems. It stops you from making things worse by trying to fix it yourself.
Data Sheet: Standard Points and Units
A standardized data sheet is key for any plant-wide vibration analysis program. It makes sure data is collected the same way. This leads to reliable trends and accurate comparisons between machines.
It outlines three main parameters with their units. Displacement is in mils or microns. Velocity is in inches per second or millimeters per second. Acceleration is in g’s.
For checking machinery health, RMS velocity is often used. It follows ISO 10816 standards.
Every asset needs a clear machine sketch. This sketch shows where each measurement is taken, like the Drive End Bearing Horizontal axis. All equipment should use the same frequency bands, like 10-1000 Hz for velocity.
This strict standard is like professional vibration testing. It turns vague observations into clear, useful data. A detailed data sheet ensures everyone understands the data the same way.
It lays the groundwork for growing condition monitoring. Using the same units and points helps maintain a systematic approach. This supports finding fault patterns and making smart decisions.


