

We often hear “peak performance” everywhere. It’s on protein shakes and PowerPoint slides, but it’s not always deserved.
But on the factory floor, it’s different. Here, “peak performance” is not just a phrase. It’s a strict, measurable goal. Your room for error is tiny, measured in microns and milliseconds.
So, how do you really improve? You don’t just work harder. You work smarter. This is where Lean meets modern process engineering.
Improving performance is like tuning a high-performance engine. You don’t get more power by pushing harder. You optimize the system.
This journey begins with a clear diagnosis of your problems. Then, we offer a specific plan: the right technology, targeted training, and cultural changes.
The aim is not just a small improvement. It’s about achieving true operational excellence. Let’s start this journey together.
Performance Metrics Defined
Imagine trying to coach a football team without knowing the score or stats. It’s like manufacturing without performance metrics. You’re just guessing.
Vanity metrics are not what you need. You need the real numbers. The ones that show if your plant is doing well or struggling.
Overall Equipment Effectiveness (OEE) is key. It’s like a quarterback rating for manufacturing. It shows how well everything is working together.
OEE looks at three things: if the machine is running, if it’s running well, and if it’s making good parts. A perfect score is 100%. Most plants score between 60-85%. Knowing your score helps you improve.
But OEE is just one part of the team. You need a list of important KPIs to manage everything.
| Metric | What It Measures | Direct Impact |
|---|---|---|
| Overall Equipment Effectiveness (OEE) | The holistic productivity of a manufacturing asset. | Identifies hidden capacity for immediate efficiency improvements. |
| Throughput | The amount of product produced in a given time period. | Directly tied to revenue generation and meeting demand. |
| Capacity Utilization | How much of your theoretical maximum output you’re actually using. | Highlights underused assets, a silent profit killer. |
| Yield Rate | The percentage of good, saleable units from the production process. | Directly measures process precision and material waste. |
| Scrap Rate | The inverse of Yield; the percentage of materials wasted. | Pure financial loss in raw material and processing costs. |
Downtime is a big worry for plant managers. An hour of unplanned stoppage costs a lot. In Fast-Moving Consumer Goods, it’s $36,000. In Automotive, it’s $2.3 million per hour.
Think of it like this. In FMCG, an hour of downtime is like wasting a year’s college tuition. In auto manufacturing, it’s like losing a brand-new luxury sedan every hour.
Measuring downtime is more than just logging hours. It’s about finding where money is leaking.
Yield and Scrap rates make problems clear. For example, TSMC, a big chip maker, focuses a lot on yield rate. A small mistake can cost $10,000.
Your scrap rate shows every mistake and error. It’s how your floor affects your bottom line.
To improve, you need to know the current state. These metrics are like medical tools. They help you understand and fix problems.
Identifying Inefficiencies
Think of your plant floor as a crime scene. Inefficiency is the thief hiding in plain sight. It doesn’t need a mask because it’s open and hidden by routine.
To fix it, we must first find the problem. Lean manufacturing teaches us about the 8 Deadly Wastes. They are like characters in a corporate tragedy.
- Defects: Products that fail inspection, leading to rework and lost customer trust.
- Overproduction: Making too much, wasting resources and space.
- Waiting: Machines and workers idle, wasting time.
- Non-utilized Talent: Skilled workers doing tasks below their level.
- Transportation: Moving materials too much, adding no value.
- Inventory: Too much stock, hiding problems and freezing cash.
- Motion: Unnecessary movement, looking for tools or info.
- Extra Processing: Polishing products too much, beyond what’s needed.
Finding these wastes is the first step. Understanding how they slow your system is key to plant optimization. Matthew Rassi’s ping-pong ball exercise is a great analogy.
Imagine a production line as workers passing ping-pong balls. Even the fastest worker is slowed by a fumble from the next person. The system’s speed is limited by its slowest link.
A bottleneck is like a kink in a hose. Pumping resources won’t help until you fix the kink. This slows down overall equipment effectiveness (OEE) and profits.
Improving plant optimization means challenging old ways. The DOWNTIME acronym helps identify waste. But we must ask “why?” to fix the root problems.
Real improvement in production efficiency comes from being honest about problems. Look at your value stream with new eyes. Question every step and process.
Is material moving too far? That’s a waste. Are skilled workers adjusting machines manually? That’s extra processing. Each waste points to a deeper problem.
By mapping the flow and finding where ping-pong balls drop, you tackle the real issues. Focus on the system, not just individual parts. This is the heart of sustainable plant optimization.
So, put on your detective hat. The clues are everywhere. Inventory piles, waiting workers, and rework stations are all hints. Find the biggest kink in your hose first. Admitting you have a flow problem is the first step to better performance.
Technology Upgrades & Automation
We’ve mapped the problems. Now, let’s talk about giving your team superpowers.
Forget the dystopian robot takeover narrative. The real tech revolution in manufacturing is more Iron Man than Terminator. It’s about making human intelligence stronger with digital help. This isn’t about replacing people; it’s about making them better.
Let’s start with the foundational upgrade: Machine Monitoring. Think of moving from a paper map to live GPS for your equipment. Before, you guessed where the traffic jams were. Now, you see every slowdown, every idle moment, in real-time.
Platforms like MachineMetrics turn raw machine data into a clear story. One case study showed a facility achieve a 15% boost in uptime and 20% gains in efficiency improvements. That’s the power of moving from reactive hunches to proactive intelligence.
But monitoring is just the dashboard. The rocket fuel comes from AI and advanced analytics. Here’s a story that should make any plant manager’s heart beat faster. A multi-agent AI system was deployed to handle complex production scheduling—a task usually reliant on one brilliant, soon-to-retire engineer’s gut instinct.
The AI didn’t replace him. It captured his expertise, digitized his genius, and ran a million simulations he never had time for. The result? A staggering 21% increase in profit. This is the ultimate knowledge transfer: saving your best engineer’s brain in the cloud before he even thinks about his gold watch.
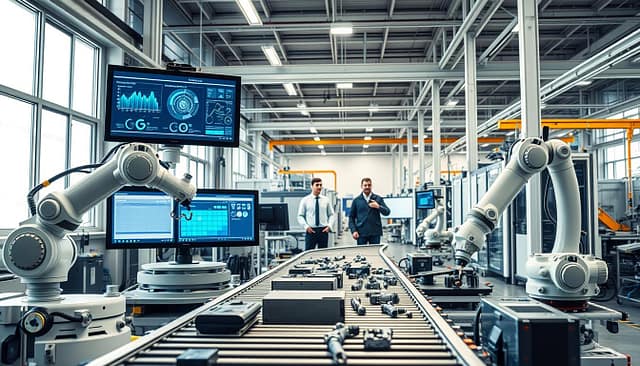
This powerful intelligence needs a central nervous system to act. That’s your Computerized Maintenance Management System (CMMS), like MaintainX. A CMMS is the conductor of the orchestra. It takes the insights from your sensors and AI, and automatically turns them into actionable work orders, parts requests, and technician dispatches.
So, what does this tech stack look like in practice?
- IoT & Smart Sensors: The eyes and ears on the ground, feeding live data.
- Data Analytics Platforms: The brain that finds patterns and predicts failures.
- CMMS Software: The hands that execute the plan, ensuring nothing falls through the cracks.
Together, they create a closed-loop system for operational excellence. You’re not just fixing things; you’re preventing them from breaking in the first place. You’re not just scheduling production; you’re optimizing it for maximum throughput and profit.
The tone here isn’t fear. It’s excitement. It’s the same feeling you got upgrading from a flip phone to a smartphone. You wonder how you ever functioned before. The path to sustained efficiency improvements is paved with these upgrades. It’s time to stop driving with a paper map.
Case Studies by Industry
Forget theoretical models; the real test of any plant optimization strategy is its performance under the harsh lights of a production floor. Think of these stories as clinical trials for operational excellence. They range from simple rituals to complex overhauls.
The lesson isn’t in the tool’s price tag, but in its focused application. Let’s examine the evidence.
A cement plant was struggling with consistent output from its ball mills. The solution wasn’t a million-dollar AI system. It was a broom.
By instituting a rigorous, weekly internal cleaning routine—a low-tech, high-discipline practice—they unlocked a 3-10% production boost. The ROI was staggering. It proved that optimizing plant performance often starts by mastering the fundamentals you’ve neglected.
Contrast that with a high-tech turnaround in a beverage bottling plant. Here, Overall Equipment Effectiveness (OEE) was languishing at a dismal 65%. The strategy was a full-scale Total Productive Maintenance (TPM) implementation, empowering operators with ownership.
The result? OEE soared to 85%, and breakdowns were slashed by 70%. This wasn’t just a technology upgrade; it was a cultural shift. The real optimization happened between the ears of the people on the floor.
Then there’s the darkly comic lesson in busywork versus effective work. An audit at a large manufacturing site revealed a shocking truth: over 1,100 preventive maintenance tasks on the books were utterly useless. They consumed time and resources but added zero value.
Rationalizing this list was a brutal exercise in honesty. It freed up thousands of labor hours for meaningful work. Sometimes, plant optimization isn’t about doing more, but about courageously stopping what doesn’t matter.
Visual management provided another win. A facility battling communication gaps and workflow hiccups installed simple, real-time performance boards across its lines. The clarity was transformative.
Suddenly, everyone from the operator to the plant manager was looking at the same data. Problems were spotted and solved in minutes, not days. This single intervention drove a 25-30% improvement in line performance. It was a masterclass in making information work for you.
Even microscopic changes can yield macro results. We’ve seen facilities gain significant reliability simply by re-evaluating and tweaking lubrication schedules and practices—a classic example of precision over volume in plant optimization.
So, what’s the unifying thread in these clinical trials? It’s focus. Whether it’s the Zen-like simplicity of a weekly clean-out or the sophisticated dance of a TPM rollout, success hinges on identifying a constraint, applying a measured solution, and tracking the result relentlessly.
The cement plant didn’t need more tech; it needed more discipline. The bottling plant didn’t just need new parts; it needed a new mindset. That’s the heart of sustainable plant optimization: a principle, not just a purchase order.
Staff Training and Knowledge Sharing
Installing sensors is easy, but understanding their data is hard. This is the main challenge of modern operations. We spend a lot on technology but forget to improve our team’s skills. The best efficiency improvements come from better training, not just new tools.
It’s time to see your team as problem solvers, not just workers. This change can make your team more flexible and creative. It’s like the difference between a strict orchestra and a jazz band that improvises.
To make this change, start by listening to your team, not just telling them what to do. Total Productive Maintenance (TPM) is a good model. It focuses on education and training, making your team more self-sufficient.
To avoid the “knowledge silo,” share information openly. Training should keep your team’s skills sharp, like a plant’s growth. Good training programs have a few key parts:
- Updated & Practical Training: Training should match your current equipment and software. It should explain why things work, not just how.
- Cross-Training as Resilience: Cross-training makes your team more flexible. It helps avoid shutdowns when someone is out.
- Skill Matrices for Visibility: A skill map helps spot training needs. It ensures no one person is too important.
The goal is to let your team find ways to improve. They know the small problems that slow things down. Training them to solve problems helps them see these issues.
Don’t ignore the human side of your team. They are the key to making your operations better. Treat them as your most valuable asset, not just a cost. Start valuing their skills and creativity.
Monitoring Results & KPIs
Starting a new strategy without checking its results is like sending a satellite without tracking. You might see it launch, but you won’t know where it’s going or if it’s in trouble. The last step in making things better is to show the results.
Your KPI dashboard isn’t a spy tool. It’s like the plant’s brain, showing if things are good or bad. If you don’t check the results, you’re just guessing.
Tiered Visual Management boards are like a war room for your operations. They turn complex data into clear, visual signs. Green means you’re doing well, and red means you need to act fast.

The goal is to take action, not just report on the past. Old reports are like history books, telling you about problems that are already fixed. Visual management makes it a live event.
This system is powerful because it creates a rhythm. It makes you review things regularly:
- Daily Huddles: A quick meeting to check the board. The team sees what needs work and plans for the day.
- Weekly Deep Dives: A longer meeting to look at trends and what worked last week.
This rhythm turns data into action. It’s the difference between making a New Year’s resolution and keeping a workout log. One is a wish; the other shows progress.
Without this system, even the best changes can fade away. What you measure and review gets better. It’s your plant’s accountability partner, making sure every change is worth it.
Sustainable Performance Improvement
Don’t try to improve efficiency like it’s a quick fix. Real, lasting change is a way of life, not a short-term solution. Sustainable improvement isn’t a project with an end date; it’s a way of life for your whole facility.
Improvement is like gardening, not building a house. You can’t just plant a garden and forget about it. You need to keep weeding, watering, and pruning. The Lean principle of “Pursuing Perfection” is about making your plant better all the time, not just once.
Changing your plant’s culture is a big job. It’s about making your organization always want to get better. Mike Ramsey says it’s about making small, smart changes that add up over time.
To create this culture, you need to stop thinking like a project. A “Lean Initiative” is a good start, but it’s not enough. True sustainable improvement is about daily habits and learning from problems.
Let’s look at the mindset change needed. The table below shows the old project model versus the new cultural approach.
| Aspect | Project-Based Mindset (The “Fad Diet”) | Cultural Mindset (The “Lifestyle Change”) |
|---|---|---|
| Primary Driver | Cost reduction targets; management mandate. | Philosophical belief in eliminating waste and empowering people. |
| Improvement Scope | Large, discrete events (e.g., “Kaizen Week”). | Continuous stream of minor, employee-led tweaks. |
| Ownership | Assigned to a special “Improvement Team.” | Embedded in every job description, from operator to CEO. |
| Measurement | Project ROI, completed tasks. | Trending KPIs, employee engagement scores, idea flow rate. |
| Long-Term Outcome | Initial gains that often regress over time. | Compounding, permanent efficiency improvements and a resilient, adaptive organization. |
The cultural model turns your workforce into a sensor network. Every operator becomes a source of data and insight. This is how you build that organizational nervous system. When a machine makes a funny noise, it’s not just a maintenance ticket—it’s a data point for the next continuous improvement cycle.
The goal is to make minor configuration changes a reflex, not a request. This is where Ramsey’s tweaks shine. Upgrading a filter type or adjusting a PM interval might seem trivial. But over a decade? These choices define your plant’s performance ceiling.
Ask yourself: Does our culture celebrate the small win? Or do we only throw parties for the big, capital-project saves? If it’s the latter, you’re missing the engine of true, sustainable growth. The most profound efficiency improvements are often silent, cumulative, and cultural.
Ultimately, this isn’t about working harder. It’s about working smarter, forever. It’s about trading the dramatic, exhausting construction project for the calm, deliberate art of gardening your operations. Your competitors might be on a diet. You’re building a healthier lifestyle.
FAQs
Let’s tackle common pushbacks and concerns directly. This is a no-nonsense guide for those tired of buzzwords about plant optimization.
You’ve got questions. We’ve got answers that might actually help.
What’s the single fastest way to boost efficiency?
Stop the variability. The quickest win isn’t a new machine. It’s enforcing Standard Operating Procedures (SOPs) with a mobile CMMS like MaintainX. When every technician follows the same checklist on a tablet, guesswork disappears. Downtime decreases. Consistency becomes your new standard.
Think of it as herding cats with a laser pointer—suddenly, they all move in the right direction.
We track Overall Equipment Effectiveness (OEE). Now what?
Congratulations! You’ve bought the thermometer. Now, diagnose the fever. Your OEE score is just a number until you use it to start a conversation. Is your weakest component Availability, Performance, or Quality?
If Availability is low, your machines are idle too often. If Performance is the culprit, they’re running too slow. Quality issues mean too much scrap. Use the metric to ask “why,” not just “what.”
Let’s not put the cart before the horse. AI is the master chef, but it needs clean ingredients. Start with basic machine monitoring to collect reliable data. Identify one clear, painful bottleneck.
Once you have that foundation, AI can predict failures or optimize schedules. Jumping straight to AI without data is like buying a Ferrari for a dirt road—impressive, but utterly useless.
How do we get buy-in from the skeptical “old guard”?
Data is the universal translator. Don’t try to sell them on the concept of plant optimization. Instead, run a pilot project on that one machine that fails every Thursday. Use a simple tool to track the issue, fix it, and show them the results.
Show, don’t tell. A victory on their turf beats a hundred PowerPoint slides.
What are the actual first steps?
It’s less about a grand plan and more about picking a fight you can win. Map your value stream to find the biggest drain. Pick one key metric that reflects that drain. Choose a simple tool to measure it.
Train a small team. Execute, review, and adjust. Repeat. Optimization is a verb, not a noun.
| Optimization Approach | Best For Solving | Key Benefit | Typical Time to Value |
|---|---|---|---|
| Mobile CMMS (e.g., MaintainX) | Workflow variability, reactive maintenance | Enforces consistency & creates audit trail | Weeks |
| OEE Analysis & Breakdown | Identifying systemic production losses | Pinpoints exact loss category (A/P/Q) | 1-2 Months |
| Basic Machine Monitoring | Unexpected downtime, lack of data | Provides foundation for all advanced analytics | Months |
| Targeted Automation | Repetitive, error-prone manual tasks | Frees skilled labor for higher-value work | Months |
| Predictive Analytics / AI | Chronic, complex failure patterns | Transforms maintenance from reactive to predictive | 6+ Months (needs clean data first) |
The path to better performance isn’t a mystery. It’s a series of pragmatic choices, starting with the question that hurts the most. Stop looking for a magic button. Start using the tools and data you already have—just more deliberately.
Conclusion
So, where are we now? We began with cold, hard numbers. We searched for inefficiencies like process engineers on a safari. We discussed technology, talent, and the cultural ties that bind them.
Improving plant performance isn’t magic. It’s about applying process engineering. It’s the hard work of systems thinking, where every detail matters.
The data shows a clear truth. Use performance metrics to set Lean goals. Get everyone involved, from top to bottom. The biggest improvements come from small, smart changes.
Don’t try to change everything at once. Your task is simple. Focus on one problem. Clean one part. Start the ping-pong ball exercise with your team today. See how one fix can spread through your system.
In the quest for top performance, the best strategy is often simple. Stick to the basics. That’s the wise person’s advice. Now, go improve your operations, one detail at a time.


